Introduction to Data Interpretation
Direction: Study the following graphs carefully to answer these questions.

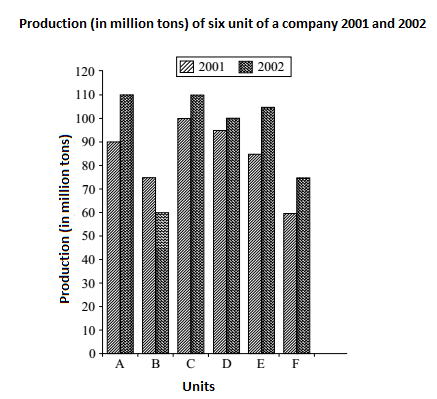
- Total production for two years together by unit F is what % of the total production of the two years together by unit D? (rounded off to two digits after decimal)
-
View Hint View Answer Discuss in Forum
As we can see in the graph that
Total production by unit F in year 2001 and 2002 together = ( 70 + 85)
Similarly calculate the same for D in year 2001 and 2002 togetherCorrect Option: A
As we can see in the graph that
Total production by unit F in year 2001 and 2002 together = ( 70 + 85 ) = 155 Million tons
Similarly
Total production by unit D in year 2001 and 2002 together = ( 95 + 100 ) = 195 Million tons
∴ Required percentage = (Total production by unit F in year 2001 and 2002 together x 100 / Total production by unit D in year 2001 and 2002 together )
∴ Required percentage = ( 155 x 100 / 195 )
=79.487 ≈ 79.49
Direction: Study the following graphs carefully and answer the questions given below:

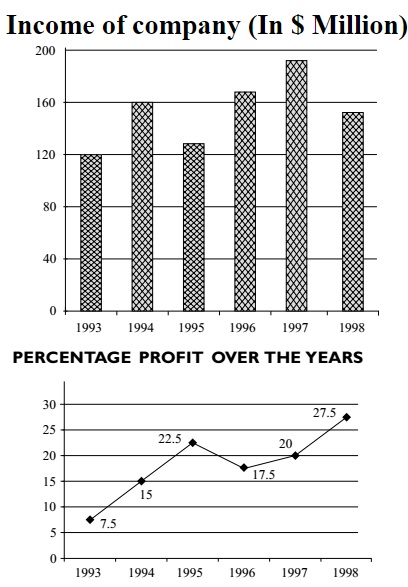
- In which of the following years was the increase/ decrease in percent profit from the previous year the minimum?
-
View Hint View Answer Discuss in Forum
We can use the direct formula for
Loss = Income x 
1 - 100 
100 - % Loss
Calculate the Percent increase/decrease from the previous year.
Correct Option: A
We can use the direct formula for
Loss = Income x 
1 - 100 
100 - % Loss
Percent profit increase/decrease from the previous year
- In which of the following years was the amount of profit the maximum?
-
View Hint View Answer Discuss in Forum
We can use the direct formula for
Profit = Income x 
1 - 100 
100 + % profit Correct Option: E
We can use the direct formulae for
Profit = Income x 
1 - 100 
100 + % profit
Calculate the profit for each year n compare them.
We can see that the profit is maximum in 1998.
- Approximately what was the average expenditure of the given years?
-
View Hint View Answer Discuss in Forum
Total expenditure in 6 years = ( expenditure in 1993 + expenditure in 1994 + expenditure in 1995 + expenditure in 1996 + expenditure in 1997 + expenditure in 1998 ).
As we can see in the given graph that,
Income in 1993 = 120
Profit = 7.5 %
Then Expenditure in 1993 = 120 X 100 / 107.5
Similarly
Expenditure in 1994 = 160 X 100 / 115
Expenditure in 1995 = 130 X 100 / 122.5
Expenditure in 1996 = 170 X 100 / 117.5
Expenditure in 1997 = 190 X 100 / 120
Expenditure in 1998 = 150 X 100 / 127.5Correct Option: B
Total expenditure in 6 years = ( expenditure in 1993 + expenditure in 1994 + expenditure in 1995 + expenditure in 1996 + expenditure in 1997 + expenditure in 1998 ).
As we can see in the given graph that,
Income in 1993 = 120
Profit = 7.5 %
Then Expenditure in 1993 = 120 X 100 / 107.5
Similarly
Expenditure in 1994 = 160 X 100 / 115
Expenditure in 1995 = 130 X 100 / 122.5
Expenditure in 1996 = 170 X 100 / 117.5
Expenditure in 1997 = 190 X 100 / 120
Expenditure in 1998 = 150 X 100 / 127.5
Total Expenditure in 6 years = ( 120 X 100 / 107.5 ) + ( 160 X 100 / 115 ) + ( 130 X 100/122.5 ) + ( 170 X 100 / 117.5 ) + ( 190 X 110 / 120 ) + ( 150 X 100/127.5 )
Total Expenditure in 6 years = 111.6 2 +139.13 + 106.16 + 144.68 + 158.33 + 117.64
Total Expenditure in 6 years = 777.56
Average expenditure per years = 777.56 / 6 = 12 .59 ≈ $ 130 Million
- If the profit percentage in 1997 was 25, what would have been the expenditure in that year?
-
View Hint View Answer Discuss in Forum
Let us assume E was the expenditure in 1997.
As we can see in the graph given that,
Income in 1997 = 190
Profit = 25 % (Given in the question.)
Then according to question,
E + E x 25 % = 190Correct Option: D
Let us assume E was the expenditure in 1997.
As we can see in the given graph that,
Income in 1997 = 190
Profit = 25 % (Given in the question.)
Then according to question,
E + E x 25 % = 190
E + E x 25 /100 = 190
(100E + E x 25 ) /100 = 190
125E / 100 = 160
125E = 190 x 100
E = 190 x 100 / 125 = 190 x 4 / 5 = 38 x 4
E = 152
Expenditure in 1997 E = 152 Million

