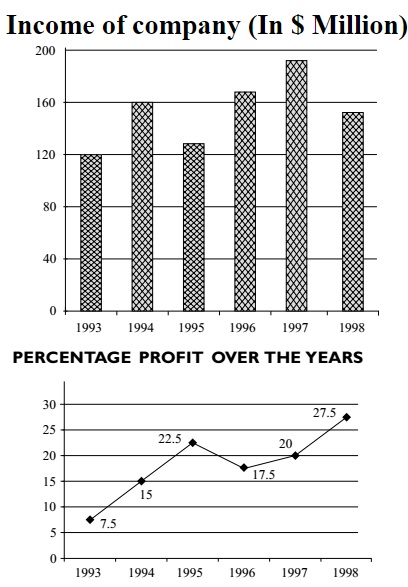
Direction: Study the following graphs carefully and answer the questions given below:

-
If the profit percentage in 1997 was 25, what would have been the expenditure in that year?
-
- $ 130 Million
- $ 148 Million
- $ 120 Million
- $ 152 Million
- None of these
Correct Option: D
Let us assume E was the expenditure in 1997.
As we can see in the given graph that,
Income in 1997 = 190
Profit = 25 % (Given in the question.)
Then according to question,
E + E x 25 % = 190
E + E x 25 /100 = 190
(100E + E x 25 ) /100 = 190
125E / 100 = 160
125E = 190 x 100
E = 190 x 100 / 125 = 190 x 4 / 5 = 38 x 4
E = 152
Expenditure in 1997 E = 152 Million

