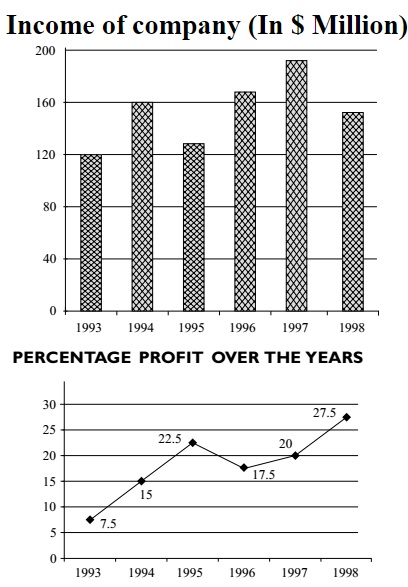
Direction: Study the following graphs carefully and answer the questions given below:

-
In which of the following years was the amount of profit the maximum?
-
- 1997
- 1994
- 1993
- 1995
- None of these
Correct Option: E
We can use the direct formulae for
| Profit | = Income x |  | 1 | - | 100 |  |
| 100 + % profit |
Calculate the profit for each year n compare them.
We can see that the profit is maximum in 1998.

