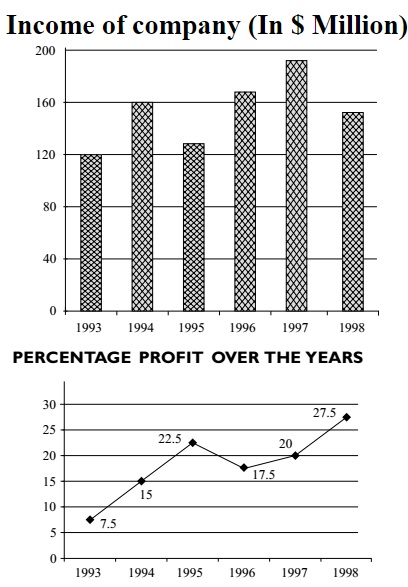
Direction: Study the following graphs carefully and answer the questions given below:

-
In which of the following years was the increase/ decrease in percent profit from the previous year the minimum?
-
- 1994
- 1996
- 1997
- 1995
- None of these
- 1994
Correct Option: A
We can use the direct formula for
| Loss | = Income x |  | 1 | - | 100 |  |
| 100 - % Loss |
Percent profit increase/decrease from the previous year


