Introduction to Data Interpretation
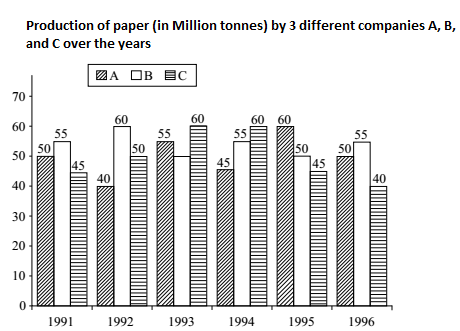
Direction: Study the following graph carefully to answer the questions given below it.

- The total production of company C in 1993 and 1994 is what percentage of the total production of company A in 1991 and 1992?
-
View Hint View Answer Discuss in Forum
Percentage production = Total production of company C in 1993 and 1994 X 100 Total production of company A in 1991 and 1992
Correct Option: E
Percentage production = Total production of company C in 1993 and 1994 X 100 Total production of company A in 1991 and 1992 Percentage production = 60 + 60 X 100 50 + 40 Percentage production = 120 X 100 = 133.3 % 90
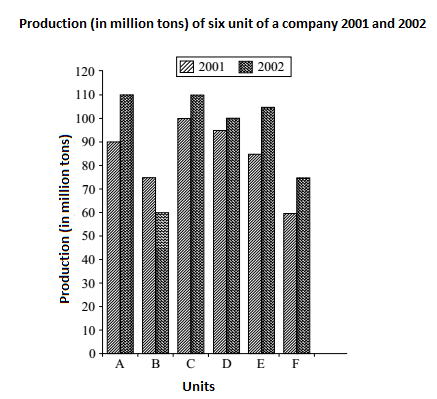
Direction: Study the following graphs carefully to answer these questions.

- What is the ratio of total production for two years together for unit B to that for C?
-
View Hint View Answer Discuss in Forum
Total production by unit B in 2001 and 2002 together = (75 + 60) = 135 Million tons
Total production by unit C in 2001 and 2002 together = (100 + 110) = 210 Million tonsCorrect Option: A
Total production by unit B in 2001 and 2002 together = (75 + 60) = 135 Million tons
Total production by unit C in 2001 and 2002 together = (100 + 110) = 210 Million tons
∴ Required ratio = (135:210) = 9:14.
- What is the average production of all the units (in million tons) for the year 2002?
-
View Hint View Answer Discuss in Forum
average production for the year 2002 = production of ( unit A + unit B + unit C + unit D + unit E + unit F ) in 2002 Total number of units
Correct Option: D
average production for the year 2002 = production of ( unit A + unit B + unit C + unit D + unit E + unit F ) in 2002 Total number of units average production of all the units (in million tons) for the year 2002 = 10 + 15 + 25 + 15 + 30 + 25 6
= 95 Million tons
- What is the total production of units C, D and E together for both the years? (in Million tons)
-
View Hint View Answer Discuss in Forum
As we can see in the graph that
Total production by unit C, D and E in year 2001 and 2002 together = (100 + 110 + 95 + 100 + 85 + 105 )Correct Option: B
As we can see in the graph that
Total production by unit C, D and E in year 2001 and 2002 together = (100 + 110 + 95 + 100 + 85 + 105 )
Required total production = (100 + 110 + 95 + 100 + 85 + 105) = 595 Million tons.
- Average production of three units A, B and C in 2001 is what % of the average production of units D, E and F in 2002? (rounded off to two digits after decimal)
-
View Hint View Answer Discuss in Forum
Average production of unit A, B and C in 2001 = production of ( unit A + unit B + unit C ) in 2001 Number of units (A + B + C ) Average production of unit D, E and F in 2002 = Production of ( unit D + unit E + unit F ) in 2002 Number of units (D + E + F ) Correct Option: C
Average production of unit A, B and C in 2001 = production of ( unit A + unit B + unit C ) in 2001 Number of units (A + B + C )
Put the value of Unit A , B and C from given graph , we will getAverage production of unit A, B and C in 2001 = 90 + 75 + 100 3 Average production of unit A, B and C in 2001 = 265 3
SimilarlyAverage production of unit D, E and F in 2002 = Production of ( unit D + unit E + unit F ) in 2002 Number of units (D + E + F )
Put the value of Unit D , E and F from given graph , we will getAverage production of unit D, E and F in 2002 = ( 100 + 105 + 85 ) 3 Average production of unit D, E and F in 2002 = 290 3
∴ Required % = Average production of unit A, B and C in 2001 x 100 Average production of unit D, E and F in 2002
∴ Required % = 265 x 3 x 100 = 91.38 3 x 290

