Control system miscellaneous
-
For a system with the transfer function H(s) = 3(s - 2) f, the matrix A 4s2 - 2s + 1
in the state space form x = Ax + Bu is equal to
-
View Hint View Answer Discuss in Forum
It is state space representation using phase variable.
Standard form
Thus ATQ an = 1, an – 1 = – 2, an – 2 = 4Correct Option: B
It is state space representation using phase variable.
Standard form
Thus ATQ an = 1, an – 1 = – 2, an – 2 = 4
- A discrete real all pass system has a pole at z = 2 ∠ 30° : it, therefore
-
View Hint View Answer Discuss in Forum
NA
Correct Option: D
NA
- A closed-loop syst em has the char acterist ic function (s2 – 4) (s + 1) + K (s – 1) = 0. Its root locus plot against K is
-
View Hint View Answer Discuss in Forum
NA
Correct Option: B
NA
- The algebraic equation F(s) = s 5 – 3s 4 + 5s 3 – 7s 2 + 4s + 20 is given. F(s) = 0 has
-
View Hint View Answer Discuss in Forum
F(s) = s 5 – 3s4 + 5s 32 – 7s 2 + 4s + 20
We can solve it by making Routh Hurwitz array.s 5 1 5 4 s 4 – 3 – 7 20 s 3 8/3 20/3 0 s 2 5 20 0 s 1 0 0 0 s 0 20 0 0
We can replace 1st element of s 1 by 10.
If we observe 1st column, sign is changing two times, so we have two poles on right half side of imaginary axis and 5s2 + 20 = 0.
So, s = ± 2 j and 1 pole on left side of imaginary axis.Correct Option: C
F(s) = s 5 – 3s4 + 5s 32 – 7s 2 + 4s + 20
We can solve it by making Routh Hurwitz array.s 5 1 5 4 s 4 – 3 – 7 20 s 3 8/3 20/3 0 s 2 5 20 0 s 1 0 0 0 s 0 20 0 0
We can replace 1st element of s 1 by 10.
If we observe 1st column, sign is changing two times, so we have two poles on right half side of imaginary axis and 5s2 + 20 = 0.
So, s = ± 2 j and 1 pole on left side of imaginary axis.
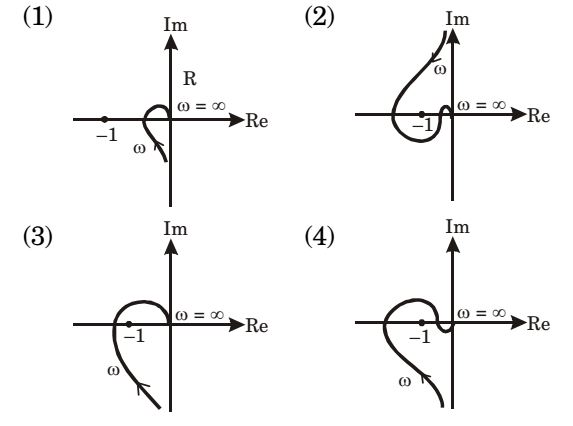
- Consider the following Nyquist plots of loop transfer functions over ω = 0 to ω = ∞ . Which of these plots represents a stable closed loop system?

-
View Hint View Answer Discuss in Forum
If GH plot incircles (– 1, j0) that is the critical point, then the system becomes unstable. So option 1 is there which does not enclose the (– 1, j0) other all are incircling the critical point.
Correct Option: A
If GH plot incircles (– 1, j0) that is the critical point, then the system becomes unstable. So option 1 is there which does not enclose the (– 1, j0) other all are incircling the critical point.

