Table chart
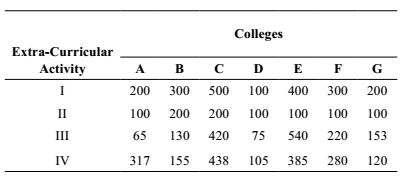
Direction: The following table shows the number of students of 7 colleges A, B, C, D, E, F, G participating in extra-curricular activities :

- The difference of the range of number of students in activity IV and the average is of number of students in activity III per college is :
-
View Hint View Answer Discuss in Forum
As per given table , we can see that the
Number of students in all given seven colleges
A = 65 , B = 130 , C = 420 , D = 75 , E = 540 , F = 220 , G = 153
Total numbers of colleges = 7
Number of students in activity IV in college C = 438
Number of students in activity IV in college D = 105Average number of students in activity III = sum of number of students in all seven colleges total numbers of colleges
∴ Difference = Range of number of students in activity IV - Average number of students in activity IIICorrect Option: C
As per given table , we can see that the
Number of students in all given seven colleges
A = 65 , B = 130 , C = 420 , D = 75 , E = 540 , F = 220 , G = 153
Total numbers of colleges = 7
Number of students in activity IV in college C = 438
Number of students in activity IV in college D = 105
Range of number of students in activity IV = Number of Highest Students in activity IV - Number of lowest Students in activity IV
Range of number of students in activity IV = 438 − 105 = 333Average number of students in activity III = sum of number of students in all seven colleges total numbers of colleges ∴ Average number of students in activity III = 65 + 130 + 420 + 75 + 540 + 220 + 153 7 ∴ Average number of students in activity III = 1603 = 229 7
∴ Difference = Range of number of students in activity IV - Average number of students in activity III
∴ Difference = 333 − 229 = 104
- The median of data pertaining to activity III is:
-
View Hint View Answer Discuss in Forum
Required Median = 
n + 1 
th observation 2 Correct Option: C
Arranging the observations of activity III in ascending order:
65, 75, 130, 153, 220, 420, 540
Number of observations ( n )= 7(odd)Required Median = 
n + 1 
th observation 2 ∴ Median = 
7 + 1 
th observation 2
= fourth observation = 153
- The college in which minimum number of students participate in extra-curricular activities is :
-
View Hint View Answer Discuss in Forum
As per given table , we can see that
The minimum number of student participated in extra curriculum in All 7 collages is 65 student.Correct Option: D
As per given table , we can see that
The minimum number of student participated in extra curriculum in All 7 collages is collage A and 65 student.
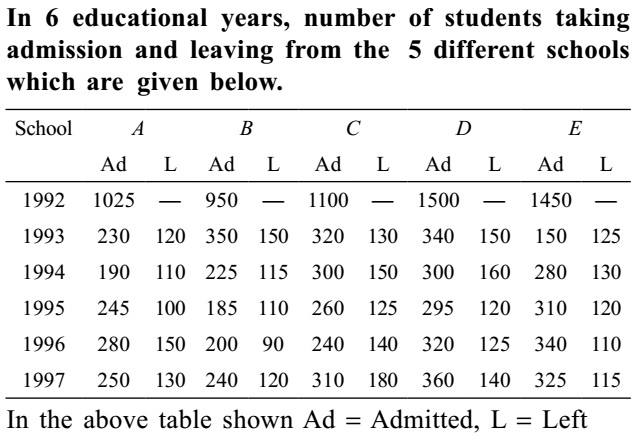
Direction: Read the following information carefully and answer the questions based on it.

- Number of students leaving school C from the year 1990 to 1995 is approximately what percentage of number of students taking admission in the same school and in the same year?
-
View Hint View Answer Discuss in Forum
Number of students leaving school C from 1990 to 1995
= 130 + 150 + 125 + 140 + 180 = 725
Number of students admitted during the period
= 1100 + 320 + 300 + 260 + 240 + 310 = 2530 =2530Correct Option: E
Number of students leaving school C from 1990 to 1995
= 130 + 150 + 125 + 140 + 180 = 725
Number of students admitted during the period
= 1100 + 320 + 300 + 260 + 240 + 310 = 2530 =2530∴ Required Percentage = 725 X 100 ≈ 29% 2530
- In which of the following schools, percentage increase in the number of students from the year 1990 to 1995 is maximum?
-
View Hint View Answer Discuss in Forum
Increase in number of students in school A = (230 − 120) + (190 − 110) + (245 − 100) + (280 − 150) + (250 − 130) = 585
Correct Option: B
Increase in number of students in school A = (230 − 120) + (190 − 110) + (245 − 100) + (280 − 150) + (250 − 130) = 585
∴ % increase from 1990 (1025) to 1995= 585 x 100 = 57.07 % 1025 Similarly, we can calculate for other schools.

