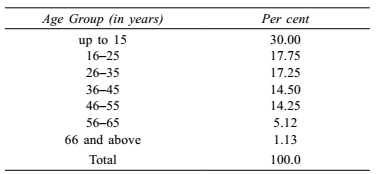
Direction: A Table showing the percentages of the total population of a State by age groups for the year 1991 is given below. Answer the questions given below it.

-
Which age group accounts for the maximum population in the State?
-
- 16–25
- 26–35
- 36–45
- 56–65
Correct Option: A
From above given table ,
Maximum population shows the age group up to 15 years, but among the options it is not there.
Hence, among the given options age group 16 − 25 is responsible for maximum population.

