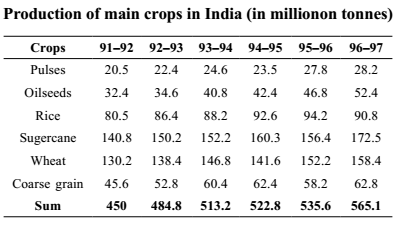
Table chart
Direction: Direction the following Table carefully and answer the questions given below.

- In which of the following years the total production of oil seeds in the years 1994–95, 1995–96 and 1996–97 was equal to the production of wheat?
-
View Hint View Answer Discuss in Forum
From above table , we have
Total production of oilseeds in the given years 1994–95, 1995–96 and 1996–97 = 42.4 + 46.8 + 52.4 = 141.6 million tonnesCorrect Option: B
From above table , we have
Total production of oilseeds in the given years 1994–95, 1995–96 and 1996–97 = 42.4 + 46.8 + 52.4 = 141.6 million tonnes
which is equal to the production of wheat in 1994−95.
Direction: Study the following table carefully and answer the questions which follow. Number of Candidates found Eligible and the Number of Candidates Short listed for Interview for a recent Recruitment Process for 6 Posts form different states

- What is the average number of candidates (approximately) found eligible for Post III from all states?
-
View Hint View Answer Discuss in Forum
Required average = sum of the number of candidates found eligible for Post III total number of states Correct Option: E
From above given table ,
Number of candidates found eligible for Post III in
State A = 5200
State B = 8400
State C = 7600
State D = 2600
State E = 3800
State F = 4400
State G = 6000∴ Required average = sum of the number of candidates found eligible for Post III total number of states = 5200 + 8400 + 7600 + 2600 + 3800 + 4400 + 6000 7 = 38000 = 5428.5 ≈ 5500 7
Direction: Direction the following Table carefully and answer the questions given below.

- Production of what type of crop was going to increase in each year in the given years?
-
View Hint View Answer Discuss in Forum
From above given table ,
It is clear that Production of oil seeds type of crop is going to increase in each year in the given years , which is shown in above table.Correct Option: D
From above given table ,
It is clear that Production of oilseeds type of crop is going to increase in each year in the given years.
i.e. increasing order of production -
32.4 > 34.6 > 40.8 > 42.4 > 46.8 > 52.4
Hence required answer will be oilseeds .
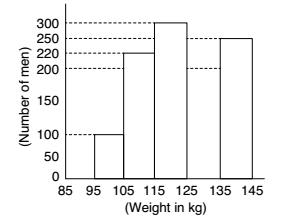
Direction: Study the histogram of weight distribution of different men and answer the question.

- Average number of men per interval who participated in this survey is :
-
View Hint View Answer Discuss in Forum
Required average = sum of numbers of men per interval who participated in this survey total numbers of men
Correct Option: C
Required average = sum of numbers of men per interval who participated in this survey total numbers of men Required average = 100 + 220 + 300 + 200 + 250 = 1070 = 214 5 5
Direction: Direction the following Table carefully and answer the questions given below.

- What was the average production of pulse in the given years?
-
View Hint View Answer Discuss in Forum
Average production of pulse = sum of total production of pulses in given years total numbers of years Correct Option: C
Given :- total production of pulses in given years ,
In 1991-92 = 20.5 million tonnes ,
In 1992-93 = 22.4 million tonnes ,
In 1993-94 = 24.6 million tonnes ,
In 1994-95 = 23.5 million tonnes ,
In 1995-96 = 27.8 million tonnes ,
In 1996-97 = 28.2 million tonnes
sum of total production of pulses in given years = 20.5 + 22.4 + 24.6 + 23.5 + 27.8 + 28.2 = 147.0 million tonnesAverage production of pulse = sum of total production of pulses in given years total numbers of years = 147.0 6
= 24.5 million tonnes

