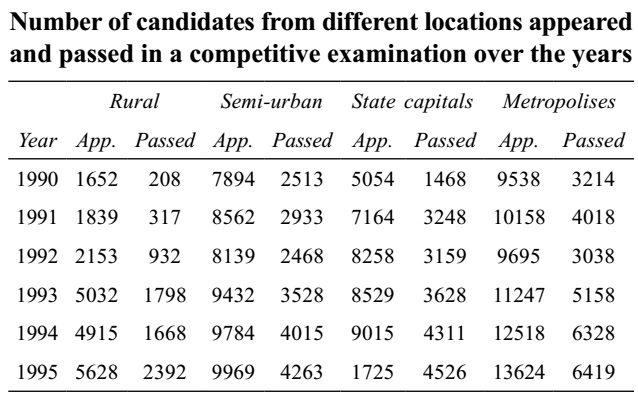
Direction: Study the following table carefully and answer the question given below it.

-
In which of the following years was the percentage passed to appeared candidates from semi-urban area the least?
-
- 1991
- 1993
- 1990
- 1992
- None of these
Correct Option: C
Our intelligent observation says that the required year cannot be 1993, 1994, 1995. Why? Because see the following conclusions:
% passed to appear = Passed / Appeared x 100
% of passed to appear is least when Passed / Appeared is the least or, Appeared / Passed is the most.
Now, we do the further calculations mentally. See the following conclusions:
For 1990: 7894 / 2513 ⇒ Quotient = 3 and Remainder ≈ 300
For 1991: 8562 / 2933 ⇒ Q = 3 and R ≈ 400
For 1992: 8139 / 2468 ⇒ Q = 3 and R ≈ 800
Similarly, for 1993; 1994, 1995, Q is 2.
So, 1992 gives the highest value.

