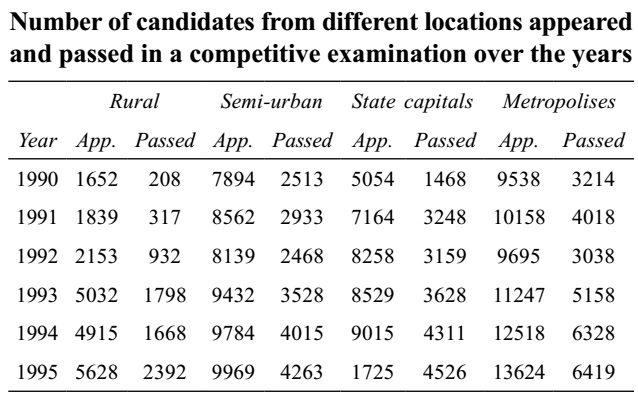
Direction: Study the following table carefully and answer the question given below it.

-
What approximate value was the percentage drop in the number of semi-urban candidates appeared from 1991 to 1992?
-
- 5
- 10
- 15
- 8
- 12
Correct Option: A
| Percentage drop = | Semi-urban candidates appeared in 1991 - Semi-urban candidates appeared in 1992 | × 100 |
| Number of semi-urban candidates appeared in 1991 | ||
| 8562 - 8139 | × 100 = | 423 | × 100 ≈ | 42 | × 10 = 5 % |
| 8562 | 8562 | 84 |

