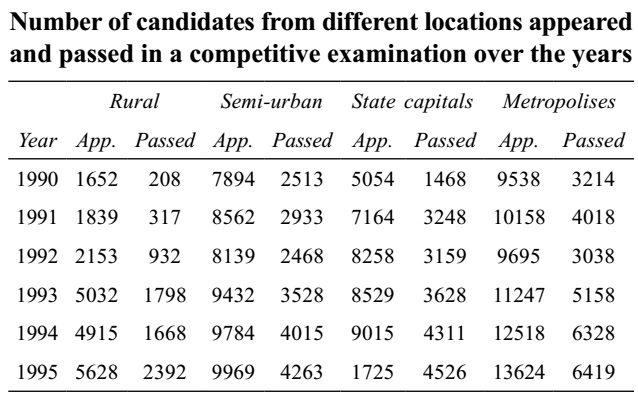
Direction: Study the following table carefully and answer the question given below it.

-
For the candidates from which of the following locations was there continuous increase both in appeared and passed?
-
- Semi-urban
- State capital
- State capital and Rural
- Metropolises
- None of these
Correct Option: D
As we can see in the graph that metropolises location has continuous increase both in appeared and passed.

