-
The magnitude Bode plot of a network is shown in the figure
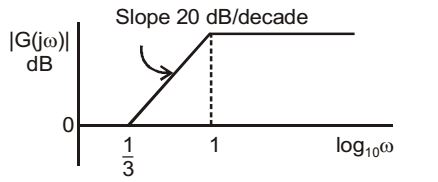
The maxi mum phase angle φm and t he corresponding gain Gm respectively, are
-
- – 30° and 1.73dB
- – 30° and 4.77dB
- +30° and 4.77dB
- +30° and 1.73dB
Correct Option: C
| G(s) = k. | ||
| (1 + s) |
| G(s) = | 3k. |  | s + | 1 |  | |
| 3 | ||||||
Here k = 1
| = | ⇒ | = 1 | ||||
| T | 3 | αT |
| ωm = | ; α = | ||
| √3 | 3 |

G m | in dB = 20 log √3 = 4.77 dB
| φm = sin-1 |  |  | |||
| 1 + α |
| α = 1 / 3 = sin-1 | | | = sin-1 | | | ||
| 1 + 1 / 3 | 2 |
φm = 30°

