-
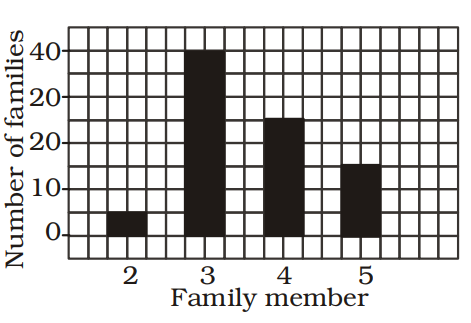
Study the bar graph carefully and answer the following question. Which type of family is the most common?

-
- 2 members
- 3 members
- 4 members
- 5 members
Correct Option: B
As per the given above bar graph , we see that
3 members type of family is the most common , which have number of families 40.
Hence , required answer is option B .

