-
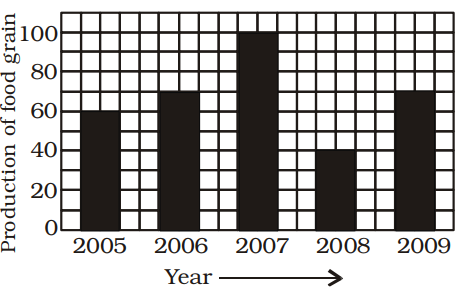
Study the above bar graph showing the production of food grains (in million tons). What is the ratio between the maximum production and the minimum production during the given period?

-
- 1 : 2
- 2 : 3
- 3 : 4
- 5 : 2
Correct Option: D
According to given bar graph , we see
The maximum production of food grains in 2007 = 100 million tonnes
The minimum production of food grains in 2008 = 40 million tonnes
∴ Required ratio = The maximum production of food grains in 2007 : The minimum production of food grains in 2008
Required ratio = 100 : 40 = 5 : 2

