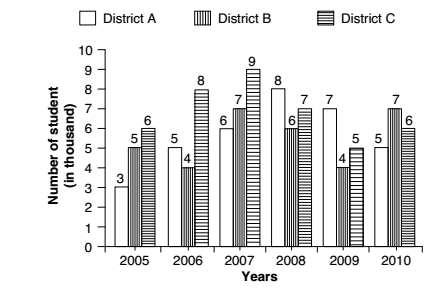
Direction: Study the following graph carefully to answer the questions that follow : Number of students (in thousand) enrolled in 3 different districts in 6 different years.
-
What was the difference between the number of students enrolled in all the 3 districts together in the year 2008 and the number of students enrolled in District B over all the years together?
-
- 12000
- 11000
- 1100
- 1400
- None of these
Correct Option: A
Students enrolled in 2008 in all three districts ( A + B + C ) = 8000 + 6000 + 7000 = 21000
Students enrolled in district B over all the years ( 2005 to 2010 ) = 5000 + 4000 + 7000 + 6000 + 4000 + 7000 = 33000
∴ Required Difference = Students in district B over all the years ( 2005 to 2010 ) − Students in 2008 in all 3 districts
∴ Required Difference = 33000 − 21000 = 12000

