-
Students taking an exam are divided into two groups, P and Q such that each group has the same number of students. The performance of each of the students in a test was evaluated out of 200 marks. It was observed that the mean of group P was 105, while that of group Q was 85. The standard deviation of group P was 25, while that of group Q was 5. Assuming that the marks were distributed on a normal distribution, which of the following statements will have the highest probability of being TRUE?
-
- No student in group Q scored less marks than any student in group P
- No student in group P scored less marks than any student in group Q.
- Most students of group Q scored marks in a narrower range than students in group P.
- The median of the marks of group Pis 100.
Correct Option: C
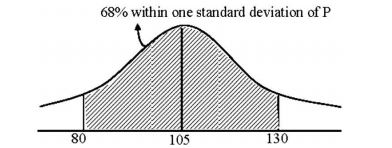
Group ‘P’
Mean (µ) = 105
Standard deviation (σ1) = 25
Pr (µ – σ ≤ x ≤ µ + σ) ≂ 0.6827
∴ 68% within one standard deviation
µ1 – σ1 = 105 – 25 = 80
µ1 + σ1 = 105 + 25 = 130
∴ range = 80 to 130
Distribution of P: 
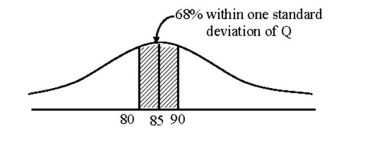
Group ‘Q’ Mean (µ2) = 85
Standard deviation (σ2) = 5
Pr (µ – σ ≤ x ≤ µ + σ) ≂ 0.6827
∴ 68% within one standard deviation
µ2 – σ2 = 85 – 5 = 80
µ2 + σ2 = 85 + 5 = 90
∴ Range of Q in one standard deviation is 80 to 90
Distribution of ‘Q’ 68% wit hin one st andar d deviat ion of Q is narrower
∴ 68% within one standard deviation of Q means most students of group Q.
∴ Most students of group ‘Q’ scored marks in a narrower range than students in group ‘P’

