-
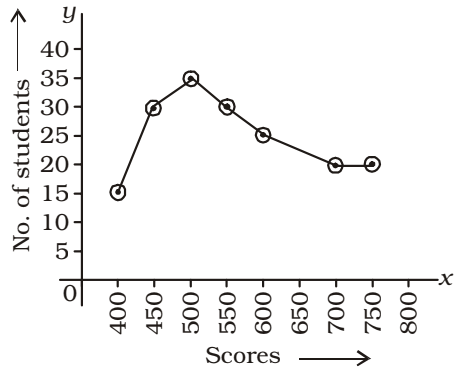
The adjoining diagram is frequency polygon for the scores of students in a test. What is the total number of students appeared in the test?

-
- 180
- 200
- 250
- 150
Correct Option: A
As per the given graph in question ,
Number of students = 15 + 30 + 35 + 30 + 25 + 22.5 + 22.5 = 180
Hence , the total number of students appeared in the test is 180 .

