-
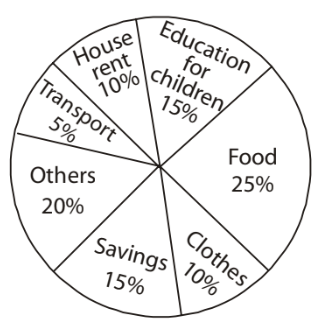
The pie - chart gives the expenditure (in percentage) on various items and savings of a family during a month. Monthly savings of the family is 3, 000. On which item is the expenditure maximum and how much is it?

-
- Others, 2,000
- Food, 3,000
- Others, 5,000
- Food, 5,000
Correct Option: D
Expenditure of food = 25%
Savings = 15%
∵ 15% ≡ $ 3000
| ∴ 25% ≡ | × 25 = $ 5000 | 15 |

