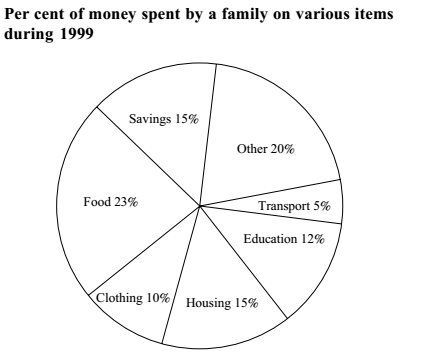
Direction: The circle graph shows the spending by a family on various items during the year 1999. Study the graph and answer these questions.
-
Graph shows that the maximum amount was spent on:
-
- Food
- Housing
- Clothing
- Others
Correct Option: A
From above graph ,
It is clear that the maximum amount was spent on Food , which is 23 % .

