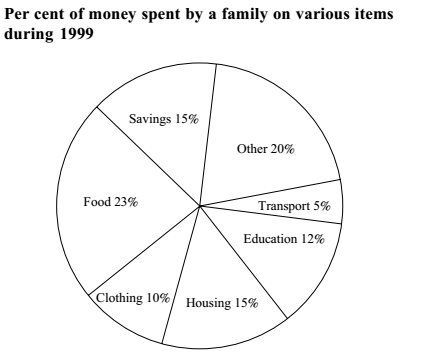
Direction: The circle graph shows the spending by a family on various items during the year 1999. Study the graph and answer these questions.
-
The ratio of the total amount of money spent on housing to that spent on education was :
-
- 5 : 2
- 2 : 5
- 4 : 5
- 5 : 4
Correct Option: D
From above given graph ,
Given that :- % amount of money spent on housing = 15%
% amount of money spent on education = 12%
Required ratio = % amount of money spent on housing : % amount of money spent on education
Required ratio = 15 : 12 = 5 : 4.

