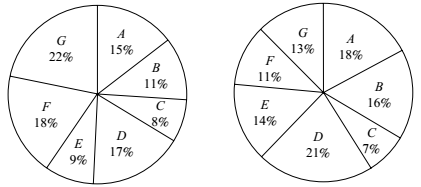
Direction: These questions are based on the following graphs : Classification of appeared candidates in a competitive test from different States and qualified candidates from those States.
Appeared candidates = 45000.
Qualified candidates = 9000.
-
What is the difference between the number of qualified candidates’ of States D and those of G?
-
- 690
- 670
- 780
- 720
- None of these
Correct Option: D
From above given pie-chart , we have
percent of qualified candidates’ of States D = 21%
percent of qualified candidates’ of States G = 13%
Required difference = ( percent of qualified candidates’ of States D - percent of qualified candidates’ of States G ) of total qualified candidates
= (21 − 13)% of 9000
| = 8% of 9000 = | x 9000 = 720 | |
| 100 | ||

