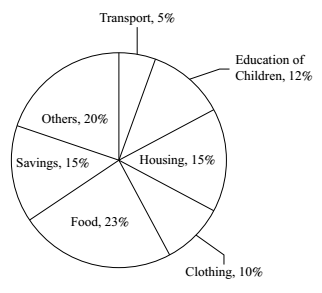
Direction: The pie-chart given below, shows the expenditure on various items and savings of a family during the year 2009.
Study the pie-chart and answer the questions based on it. Percentage of money spent on various items and savings by a family during 2009.
-
The savings of the family for the year were equal to the expenditure on:
-
- Food
- Housing
- Education of children
- Clothing
Correct Option: B
As per given chart , we can see that
The savings of the family for the year is equal to the expenditure on housing.
Hence ,correct option is B.

