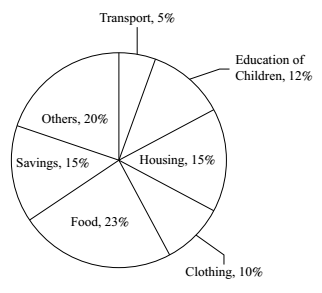
Direction: The pie-chart given below, shows the expenditure on various items and savings of a family during the year 2009.
Study the pie-chart and answer the questions based on it. Percentage of money spent on various items and savings by a family during 2009.
-
If the total income of the family was $ 1,50,000 then the money spent on food was :
-
- $ 20,000
- $ 23,000
- $ 30,000
- $ 34,500
Correct Option: D
given in the question,
Total income of the family = $ 1,50,000
From above graph ,
Total expenditure on food = 23%
Expenditure on food = Total income x % Expenditure on food
Expenditure on food = 150000 x 23 %
| Expenditure on food = 150000 x | 23 | = $34500 |
| 100 | ||

