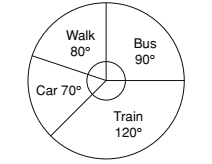
Direction: The pie chart given below represents the number of students using different transport to a school in which total number of students is 2160.
Answer the questions based on the following diagram.

-
The ratio of the total number of students who come to school by car to the total number of students who come to school by bus is:
-
- 21 : 24
- 21 : 27
- 36 : 27
- 36 : 21
Correct Option: B
From above diagram ,
The total number of students who come to school by car is represented in pie chart = 70°
The total number of students who come to school by bus is represented in pie chart = 90°
Required ratio = 70° : 90° = 7 : 9 = 21 : 27

