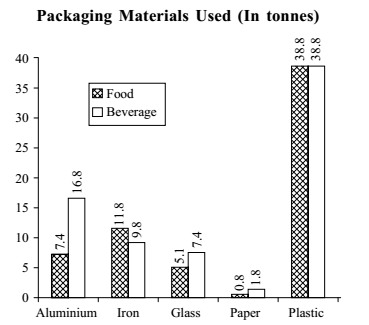
Direction: Study the following graph carefully and answer the questions given below it.

-
Approximately what % of all the packaging materials used for packing food items and beverages was contributed by plastic and aluminium together?
-
- 60
- 70
- 80
- 65
- 75
Correct Option: E
Total Plastic and Aluminium used for food items and beverages = ( Plastic + Aluminium ) used for food and beverage
Total Plastic and Aluminium used for food items and beverages = 7.4 + 16.8 + 38.8 + 38.8 = 101.8
Total All material for food items and beverages = ( Aluminium + Iron + Glass + Paper + Plastic ) used for food and beverage.
Total All material food items and beverages = 7.4 + 16.8 + 11.8 + 9.8 + 5.1 + 7.4 + 0.8 + 1.8 + 38.8 + 38.8 = 138.5
| Required % = | Total Plastic and Aluminium used for packing the food items and beverages | X | 100 |
| Total All material used for packing the food items and beverages |
| Required % = | 101.80 | X | 100 | ≈ 75% |
| 138.5 |

