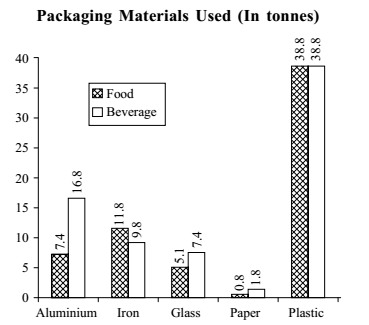
Direction: Study the following graph carefully and answer the questions given below it.

-
Approximately how much % more plastic was used than iron for packaging food items?
-
- 32
- 320
- 33
- 325
- 225
Correct Option: E
| Percentage increase = | Plastic used for packing food items - Iron used for packing food items | X | 100 |
| 18.8 |
As per given graph
Plastic used for packing food items = 38.8
Iron used for packing food items = 11.8
| Percentage increase = | 38.8 - 11.8 | X | 100 | ≈ 225% |
| 11.8 |

