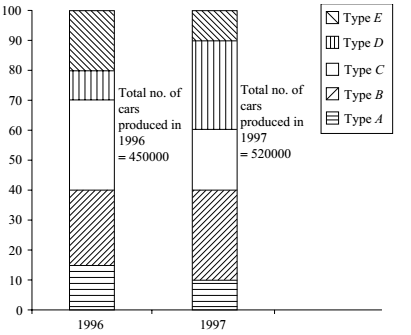
Direction: Study the following graph carefully and then answer the questions based on it. The percentage of five different types of cars produced by a company during two years is given below.

-
In the case of which of the following types of cars was the percentage increase from 1996 to 1997 the maximum?
-
- A
- E
- D
- B
- C
Correct Option: C
Clearly, by visual inspection D is the desired option.

