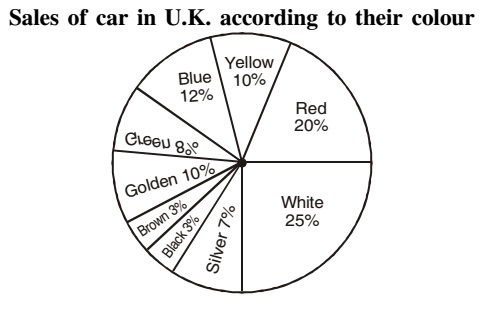
Direction: Study the following pie-chart and answer given below:
-
If the total production of cars during a certain period was 42000, how many more blue cars were sold in comparison to golden cars.
-
- 8400
- 12580
- 12850
- 13618
Correct Option: A
Required difference = ( blue car % - golden car % )x420000/100
Required difference = (12 -10)/100 x 420000 = 2/100 x 420000 = 8400

