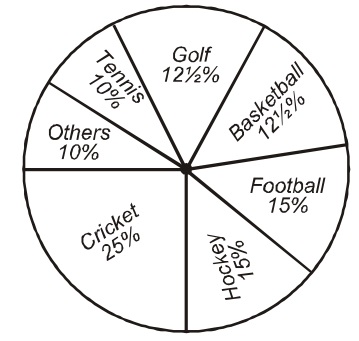
Direction: The pie chart, drawn here, shows the spending of a country on various sports during a particular year. Study the graph carefully and answer the questions that follow:
-
Out of the following the country spent the same amount on:
-
- Hockey and Cricket
- Hockey and Football
- Hockey and Golf
- Tennis and Golf
Correct Option: B
According to the graph, equal amount has been spent on Hockey and Football because the same percentage given in graph.
Expenditure on the game of Football = 15% of total amount spent
Expenditure on the game of Hockey = 15% of total amount spent

