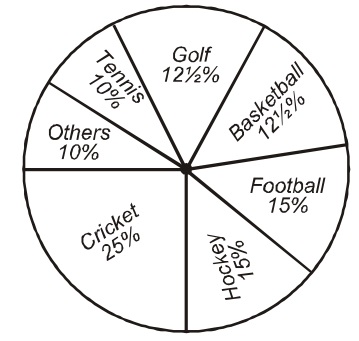
Direction: The pie chart, drawn here, shows the spending of a country on various sports during a particular year. Study the graph carefully and answer the questions that follow:
-
If the total amount spent on sports during the year was Rs. 1,20,00,000. how much was spent on basketball?
-
- Rs. 16,00,000
- Rs. 18,00,000
- Rs. 3,00,000
- Rs. 15,00,000
Correct Option: D
According to question, Total spent 100% = 1,20,00,000
According to graph,
∴ Expenditure on the game of Basketball = 121/2 %
∴ The Amount spend on the game of Basketball = 121/2% of 1,20,00,000 = 25 x 1,20,00,000/100 = Rs. 15,00,000

